I'm running TLC via the Toolbox and I'm observing an impressive decrease of throughput over time.
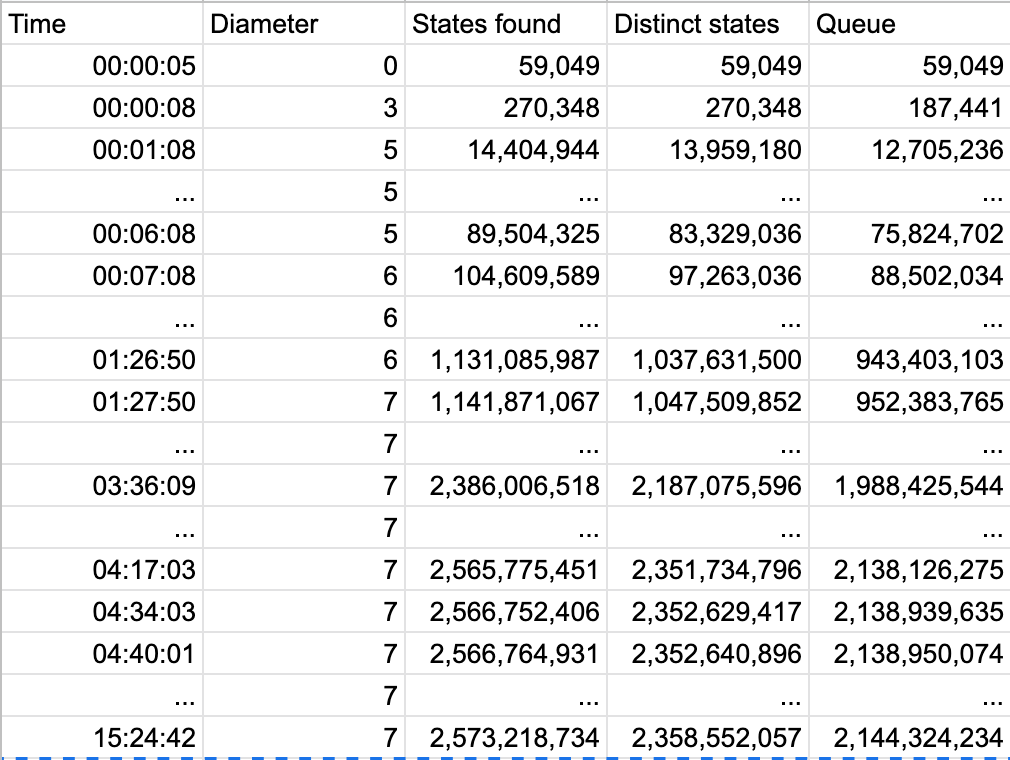
Here's an abridged summary of the state space progression with additional details below:


From start to 01:26:50 the rate was around 14 million states per minute.
From 01:26:50 to 03:36:09 it slowly decreased from 14 to about 10 million states per minute.
At 03:36:09, it suddenly decreased from 10 to around 4 or 5 million states per minute and stayed there until 04:17:03.
Between 04:17:03 and 04:34:03 there was nothing. The metric jumps from 17 minutes and only 976,955 more states.
Same thing between 04:34:03 and 04:40:01, it jumps by 6 minutes and 12,525 states.
Then, from 04:40:01 to 15:24:42 the metrics logging restarts every minute at a rate of only about 10K states per minutes,
until I went back to my laptop and cancelled the task.
It's running on my 2018 MacBook Pro:
- 2.6 GHz 6-Core Intel Core i7
- 32 GB 2400 MHz DDR4
When I checked the same spec on a smaller number of initial states (with the same parameters, see below) the day before, my fan went all crazy and I witnessed almost 100% usage of all my cores. TLC stopped after around an hour at 190 million states and diameter 100-something if I remember correctly (here the diameter never got past 7).
In this instance, CPU usage did not exceed 25% from what I could see between two "doing my weekend business".
The first time I ran this model it took up 300Gb of disk space which was more than was left on my SSD, so it stopped.
The state space progression above is from the next run I did, replacing the storage unit with a 1Tb HDD I had at home (I don't know much about its characteristics other than storage capacity).
So disk I/O does not seem to be the problem, I guess.
Here are the relevant (I think) settings I have used. Basically turning some knobs up regarding my hardware but not sure what I was doing.
TLC Options:

Toolbox settings:
Are my settings the reason why increasing the number of initial states leads to lower CPU usage? Or is it something with the way the spec is written?
And what could explain this decreasing throughput behavior?