|
On 28.08.2018 05:54, Rachel Delafon
wrote:
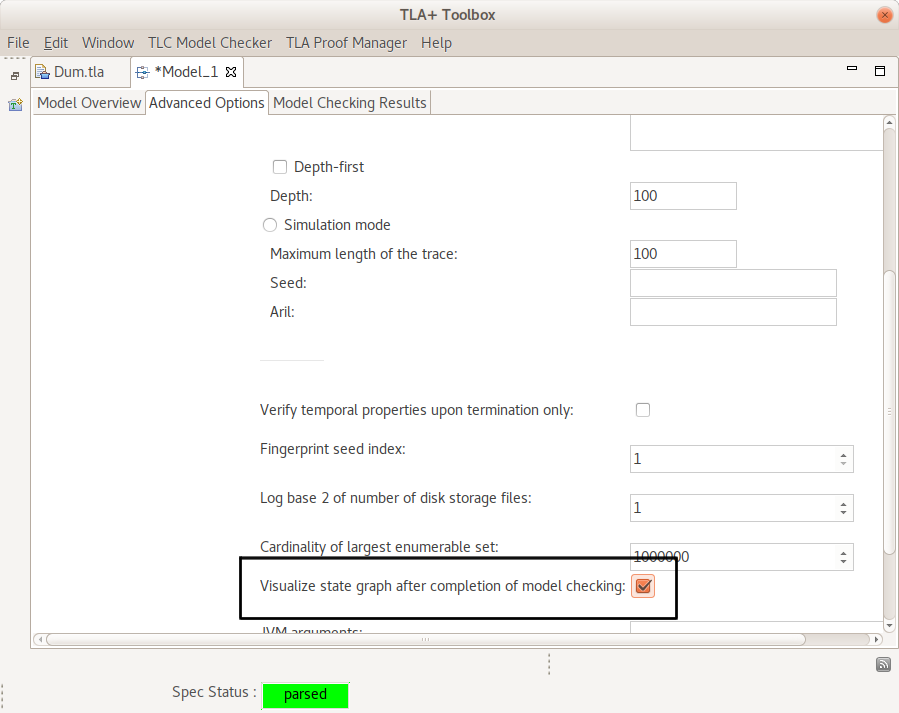
Hi Rachel, if dot is not installed in the standard path, please adjust the dot path in the Toolbox's preferences (File > Preferences > TLA+ Preferences > PDF Viewer > Specify dot command). Afterwards check "Visualize state graph after completion of model checking" before you run model-checking on the "Advanced Options" page of the model editor (see attached screenshot). The Toolbox will then add a tab to the model editor showing the state graph once model checking has completed. Note that the visualization is only useful for small state spaces. For larger ones, the dot rendering will timeout. In this case you can try to render the dot output file manually on the command line with a different dot settings, i.e. layout. The dot file is found in the model subdirectory of your specification. Thanks Markus |
Attachment:
StateGraphVisualization.png
Description: PNG image